
Bull Call Spread: How It Works, Formulas, and a Real DIS Example
By OptionsPriceCalculator Team · Published October 23, 2026 · Updated October 23, 2026
A call debit spread, better known as a bull call spread, means buying a call option at a lower strike and selling a call at a higher strike price, both with the same expiration date. You pay a net debit, which is your maximum loss. You earn the maximum profit - the distance between the strikes minus the debit - if the stock finishes at or above the higher strike.
In plain words, it’s a cheaper long call with a ceiling. You give up gains above your target in exchange for a lower cost and a closer breakeven. This strategy is part of our options strategies guide. To test it with your own numbers, open the bull call spread calculator.
How a Bull Call Spread Works
- Long call (lower strike). Your bullish engine. It gains as the stock rises.
- Short call (higher strike). Brings in premium that lowers your cost - and caps your profit at that strike.
- Same expiration. Both legs expire together.
- Net debit. What you pay upfront; you can never lose more than this.
Why sell the upper call?
Every call you buy includes a price for the chance of a huge rally. If your honest target is moderate, you’re paying for upside you don’t expect. Selling the higher-strike call sells back that unlikely upside to someone else and uses the money to cut your cost.
“Debit spread” vs “bull call spread”
Both names describe the same trade. Debit refers to paying money to open it; bull refers to the view. Its mirror image, the bull put spread, gives the same bullish exposure but opens for a credit.
Bull Call Spread Formulas
K1 = long (lower) strike, K2 = short (higher) strike.
| Metric | Formula | What it tells you |
|---|---|---|
| Net debit | Call(K1) - Call(K2) | Your cost and maximum loss per share |
| Maximum loss | Net debit x 100 | Stock at or below K1 at expiration |
| Maximum profit | (K2 - K1 - Net debit) x 100 | Stock at or above K2 at expiration |
| Breakeven | K1 + Net debit | Price needed for a $0 result |
| Profit-to-risk ratio | Max profit / Max loss | How much you can make per dollar at risk |
| P/L at expiration | [min(max(S - K1, 0), K2 - K1) - Net debit] x 100 | S = stock price |
A quick check: the spread can never be worth more than the strike width. On a $10-wide spread, the most it can ever be worth is $10 per share - so paying more than that makes no sense, and paying close to it leaves little room for profit.
Building It Step by Step: A Bull Call Spread on Disney (DIS)
Here’s an example based on late September 2026 prices. Disney trades near $104.23, in the middle of its 52-week range of $92.19 to $117.09, and down about 8% this year. Analysts are more optimistic than the market: the average 12-month target is around $127, with a range from $88 to $144.
Suppose your view is moderately bullish: DIS recovers toward $115 - its recent highs - by year-end, but you don’t expect it to hit analyst targets that fast. That’s a textbook spread setup.
Step 1 - Buy a call near the current price: $105 strike Step 2 - Sell a call at your target: $115 strike Step 3 - Pick an expiration that gives the move time: December 18, 2026 (86 days) Step 4 - Enter as one order:
- Buy 1 DIS $105 call -> $5.40
- Sell 1 DIS $115 call -> $1.85
- Net debit: $3.55 per share -> $355
Note: premiums are illustrative Black-Scholes estimates at ~27% implied volatility, adjusted for Disney’s dividend. Disney’s fiscal fourth-quarter report typically comes out in mid-November, inside this window. Check live quotes before trading.
The math for this trade
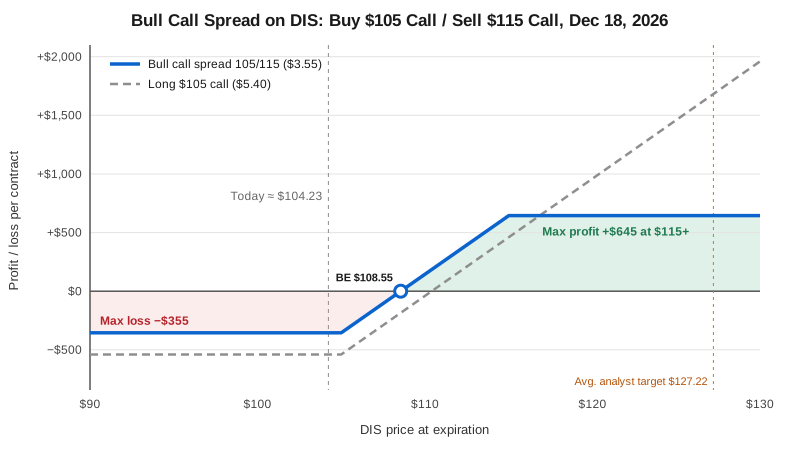
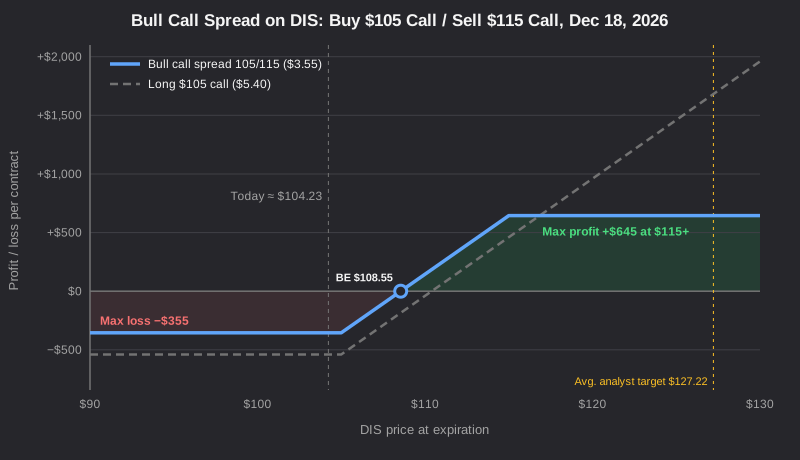
- Maximum loss: $355 (DIS at or below $105 on Dec 18)
- Maximum profit: ($10 - $3.55) x 100 = $645 (DIS at or above $115)
- Breakeven: $105 + $3.55 = $108.55 (+4.1% from today)
- Profit-to-risk ratio: about 1.8 : 1
- Estimated odds: roughly 37% of finishing above breakeven and 22% of reaching max profit
Scenarios at expiration
| DIS on Dec 18 | Bull call spread 105/115 | Long $105 call alone |
|---|---|---|
| $95 | -$355 | -$540 |
| $104.23 (today) | -$355 | -$540 |
| $108.55 | $0 | -$395 |
| $110.40 | +$185 | $0 |
| $115 | +$645 | +$460 |
| $120 | +$645 | +$960 |
| $127.22 (avg. target) | +$645 | +$1,682 |
Try it yourself: load this DIS setup in the calculator and move the strike or expiry to see the payoff and Greeks change.
Read this table by columns. The spread loses less, breaks even sooner, and earns more at $115. The long call only pulls ahead if DIS runs well past your target.
Spread vs Long Call: The Real Trade-Off
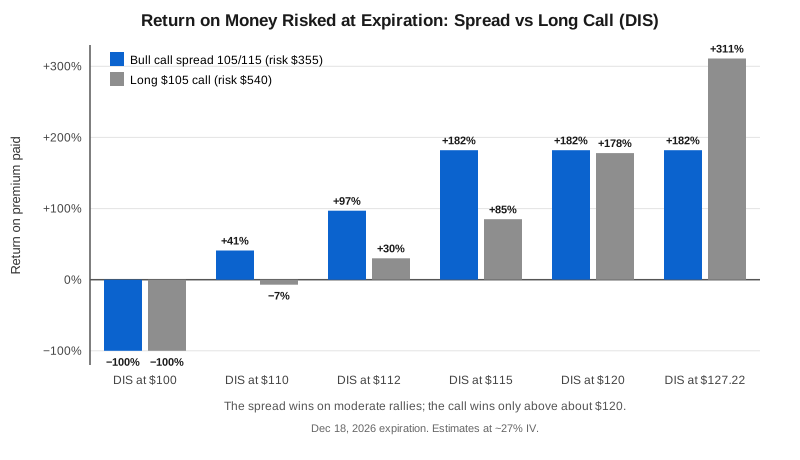
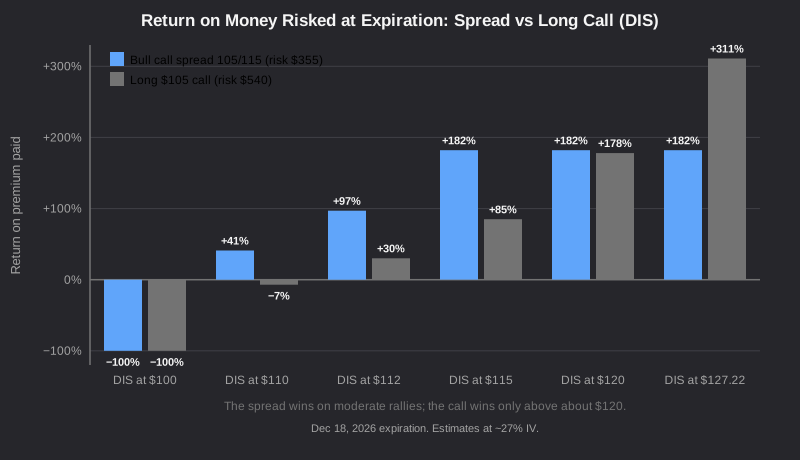
Looking at returns instead of dollars makes the difference clearer:
| Criteria | Long $105 call | Bull call spread 105/115 |
|---|---|---|
| Cost / max loss | $540 | $355 |
| Breakeven | $110.40 | $108.55 |
| Max profit | Unlimited | $645 |
| Return at $115 | +85% | +182% |
| Where the call wins | Above ~$120 | - |
| Delta (share-equivalent) | ~52 | ~27 |
| Theta (daily decay) | ~-$3.50 | ~-$0.92 |
| Vega (per IV point) | ~+$20 | ~+$4 |
The last three rows explain why spreads feel “calmer.” Because the short call offsets part of the long call, the spread is less sensitive to time decay and volatility - but also to price. It moves more slowly in both directions.
A simple rule: if your target is modest and specific, use the spread. If you want to keep the lottery-ticket upside, use the call.
How the Spread Behaves Before Expiration
| Path | DIS | Days left | Spread P/L | Long call P/L |
|---|---|---|---|---|
| Quick +5% | ~$109.40 | 72 | +$141 | +$257 |
| Stronger +10% | ~$114.65 | 56 | +$307 | +$592 |
| +10%, near expiration | ~$114.65 | 7 | +$467 | +$432 |
| Dip -5% | ~$99.00 | 56 | -$185 | -$333 |
| Flat | ~$104.23 | 30 | -$96 | -$243 |
Two things stand out:
- Early rallies pay the call more. With lots of time left, the short $115 call still holds value, so the spread captures only part of the move. The spread “catches up” as expiration approaches.
- Flat or falling markets hurt the spread less. Its smaller debit and lower theta make waiting cheaper.
That’s why spread traders are usually patient. Much of the profit arrives in the final weeks, once the short call’s time value fades.
Choosing the Strikes
Same DIS, same December 18 expiration:
| Spread | Debit | Max profit | Breakeven | Profit : risk | Est. odds above breakeven |
|---|---|---|---|---|---|
| $100 / $110 (in the money) | $492 | $508 | $104.92 | 1.0 : 1 | ~48% |
| $105 / $110 (narrow) | $211 | $289 | $107.11 | 1.4 : 1 | ~41% |
| $105 / $115 | $355 | $645 | $108.55 | 1.8 : 1 | ~37% |
| $105 / $120 (wide) | $446 | $1,054 | $109.46 | 2.4 : 1 | ~35% |
| $110 / $120 (out of the money) | $235 | $765 | $112.35 | 3.3 : 1 | ~28% |
The pattern is the same across every debit spread:
- In-the-money spreads cost more, win more often, and pay about 1 : 1.
- Out-of-the-money spreads are cheap and pay 3 : 1 or more - but need a bigger move and win less often.
- Wider spreads give more room to profit but cost more and behave more like a plain call.
In practice, I put the short strike at my realistic target and the long strike near the current price. That keeps the trade aligned with the view instead of with whatever looks cheapest.
The Greeks of a Bull Call Spread
For the $105 / $115 spread at entry:
- Delta: about +27 shares. Moderately bullish.
- Theta: about -$0.92 per day. Mild - the short call’s decay offsets most of the long call’s.
- Vega: about +$4 per IV point. Small; the spread is mostly a bet on price, not volatility.
- Gamma: positive near the long strike, negative near the short strike. The spread gains fastest when the stock sits between the strikes.
How to Manage a Bull Call Spread
- Place the short strike at your target. That’s where the trade reaches max profit.
- Give it time. 45-90 days gives the stock room to move and keeps theta manageable.
- Take profits at 50-75% of max. Waiting for the last few dollars ties up capital for little reward.
- Cut losers early. If the thesis breaks, closing at half the debit preserves capital for the next idea.
- Watch early assignment. If the short call goes deep in the money, especially before an ex-dividend date, it may be assigned. Your long call covers it, but it’s cleaner to close the spread.
Before placing the trade, check your worst case in the calculator.
Risks and Limitations of the Bull Call Spread
- Capped upside. Gains stop at the short strike no matter how far the stock runs.
- Can lose 100% of the debit. If the stock ends at or below the long strike, both calls expire worthless.
- Slow early response. Profits build gradually until expiration nears.
- Two bid-ask spreads. Costs are higher than for a single option.
- Early assignment of the short call. Uncommon but possible, especially around dividends.
When a Bull Call Spread Makes Sense (and When It Doesn’t)
It fits when you’re moderately bullish with a specific target, want a defined and smaller risk than a long call, and prefer lower sensitivity to time decay and volatility.
It doesn’t fit when you expect an explosive rally (a long call keeps the upside), when you’d rather collect premium on a bullish view (a bull put spread or cash-secured put), or when options are so cheap that buying the call outright makes more sense.
Frequently Asked Questions (FAQ)
What is a bull call spread?
It’s buying a lower-strike call and selling a higher-strike call with the same expiration. It profits from a moderate rise and has a fixed maximum loss and gain.
Is a call debit spread the same as a bull call spread?
Yes. “Call debit spread” describes how it’s opened - for a net debit. “Bull call spread” describes the view.
What is the maximum profit on a bull call spread?
The distance between the strikes minus the net debit, times 100. It’s reached if the stock finishes at or above the higher strike.
Why use a bull call spread instead of buying a call?
It’s cheaper, has a closer breakeven, and loses less to time decay. The trade-off is that profit is capped at the short strike.
Related strategies
- Alternative: Long Call
- Built from: Long Call + Short Call
- Key terms: Break-even Price, Vega, Theta (Time Decay)
Risk Disclaimer: This article is for educational and informational purposes only and does not constitute investment, financial, legal, or tax advice. Options trading involves risk and is not suitable for all investors; you can lose the entire amount invested in an options position. Prices, premiums, implied volatility, probabilities, analyst targets, and scenarios in the examples are illustrative and may differ from live market data. Earnings dates may change. Past performance does not guarantee future results. Before trading options, read Characteristics and Risks of Standardized Options (OCC) and consult a licensed financial professional.